
In this article I want to provide a review of the Deleaker plugin for Visual Studio and Qt Creator.
The motiviation
Every C++ developer knows about the trouble finding memory leaks. We are using a language that doesn’t rely on a garbage collector. That has advantages and disadvantages. One of the latter is that we produce code that causes memory leaks. That happens to the best and scrupulous among us. But how do we deal with that? The language itself doesn’t give us many means at hand. That’s where tools and SDKs step in.
What we have
Microsoft provides the notorious macros defined in afx.h. We redefine “new”, add reporting hooks, make everything platform save to still compile on Unix or OS X. It’s ok, but not very comfortable. I provided a description in an older post here.
What we want
- We don’t want to mess our code with directives
- We want tool integration
- We want powerful help finding memory leaks
- We want it easy and comortable
Where we go
That’s where Deleaker steps in. It is a plugin for Visual Studio and Qt Creator (and some more IDEs that I don’t have on my computer) that aims at providing a tool that helps us finding leaks and fixing them. It can also be used stand alone for analysing and reporting leaks in executables.
How it works
Deleaker comes with an intstaller that detects Visual Studio and Qt Creator and adds itself as a plugin. I primarily use Visual Studio 2019, so I will focus on that.
It does not require any special macros or modifications or other measures applied to the code. It hooks into the debug runtime and works in the background.
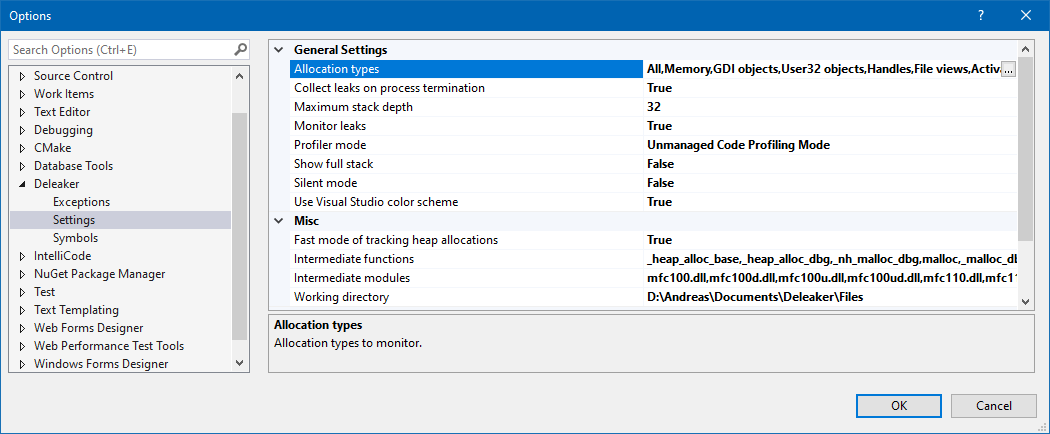
Deleaker comes with extensive configuration probably covering a lot of more specific demands. I basically used the default configuration, which is probably very ok for most cases:
A minimum test scenario
I created a minimum test that provokes some memory leaks:
- one immediately in main() where I allocate 42 characters
- one as an object of type MyClass that allocates 8 chars. It is dynamically created and not deleted.
- 100 chars created with new inside the MyClass constructor
myClass.h
class MyClass { public: char text[8]; char *anotherText; MyClass(); }; |
myClass.cpp
#include "MyClass.h" MyClass::MyClass() { anotherText = new char[100]; } |
DeleakerTest.cpp
#include "MyClass.h" int main() { char* someMemory = new char[42]; MyClass* myObject = new MyClass(); } |
Can Deleaker find all three leaks?
I made a release build and started Deleaker as a standalone program. I pointed it at the DeleakerTest.exe and hit “Start Debugging”. As soon as the program ends Deleaker opens and shows the following result (I removed some columns to save screen space):
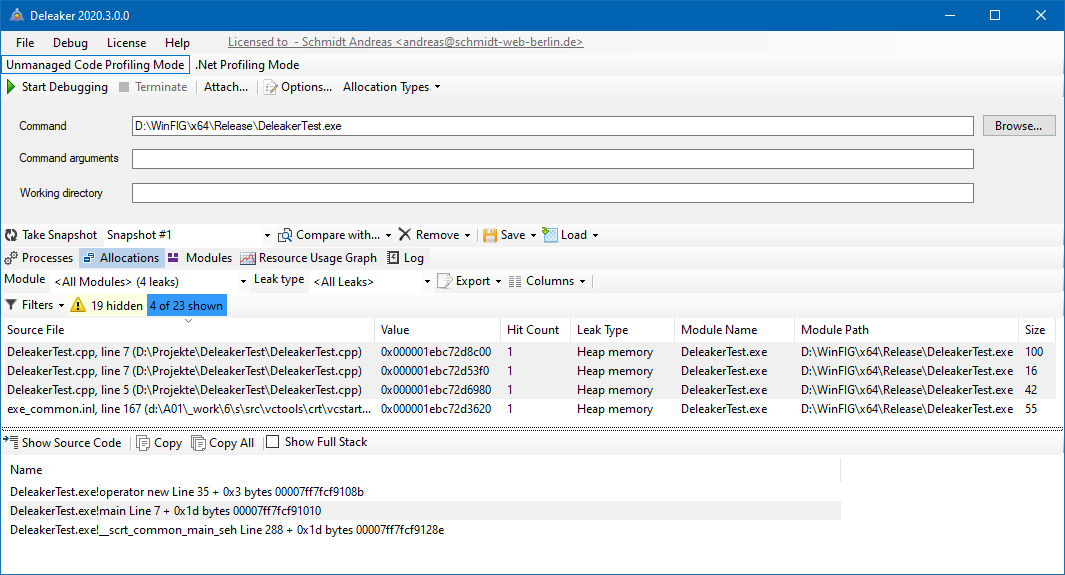
As we can see, it found all three leaks with correct size of:
- 100 bytes for anotherText
- 16 bytes for the instance of MyClass. This includes the instance object and its members.
- 42 bytes for someMemory
It points at the source file and line number.
There is a fourth leak that I think is a false positive caused by boilerplate code that we can ignore.
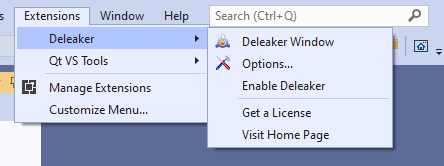
Of course, I in day to day programming I rather want to do that from inside the IDE. So I activated the plugin from the Extension menu simply by selecting “Enable Deleaker”
After running DeleakerTest we get the same dialog again:
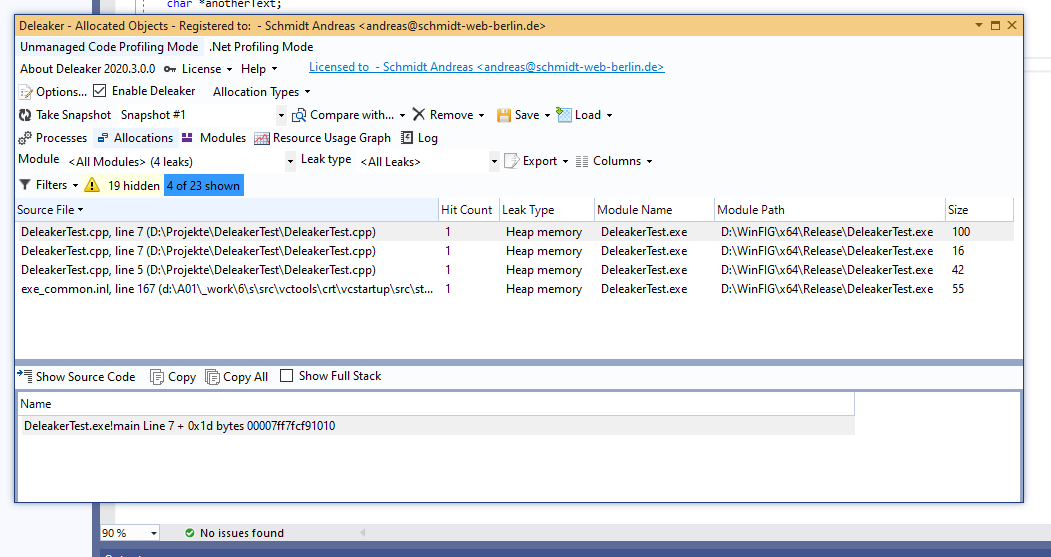
A click on a leak in the list jumps to the source file and line in Visual Studio, which is a very handy feature.
Finding and listing the leaks is only one benefit. This alone could be done with more simple means such as redefining the “new ” operator and using Visual Studio’s _CRT_REPORT_HOOK for dumping all the leaks and the line number. But that still doesn’t tell you which control path led to the leak. Imagine you have some function that creates a copy of an object on the heap and you forgot to delete that copy. You would have to check all places that use that function directly or indirectly and the paths that lead to there. That can become complex and time consuming. Here Deleaker shows its true strength because it provides you with the call stack. Simply click on an entry and it navigates you to the source code. What could be hours is now only seconds away.
Here is an example of my program “WinFIG” where copy_points cloned the points of a polyline, which was then never deleted and thereby caused a memory leak. copy_points is a utility function and there used in several places. How would I know what really happened? That’s where the call stack helps by leading up to the mouse click handler that initiated the copy operation in this example. It provides a helpful context to understand better what actually happened and opens the source file by clicking. Much better than looking at simple report dumps.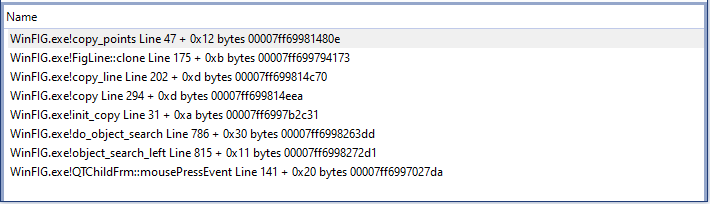
Verdict
I found Deleaker very useful and promising. I would probably not enable it all the time, but when it comes to finishing a milestone or a release and go hunting for memory leaks during the testing phase, then Deleaker is what may save you many headaches and improve the quality of your product.
Deleaker has many more features that I could not even touch, like saving and comparing snap shots, filtering or detailed configuration. The good news is: I didn’t really have to in order to make it do what I want it to do: finding the typical memory leaks resulting from day to day coding. I’m positive it can be tuned for more complex use cases including threaded code, linked modules etc.